Wondering how many kids might be treat-or-treating in your neighbourhood on Saturday night? Check out these trick-or-treater density maps developed by a software company in British Columbia.
MountainMath Software is a Vancouver company that specializes in data analytics, modeling, and visualization. Jens von Bergmann and Alejandro Cervantes created the Census Mapper website to make data from the Canada Census more accessible.
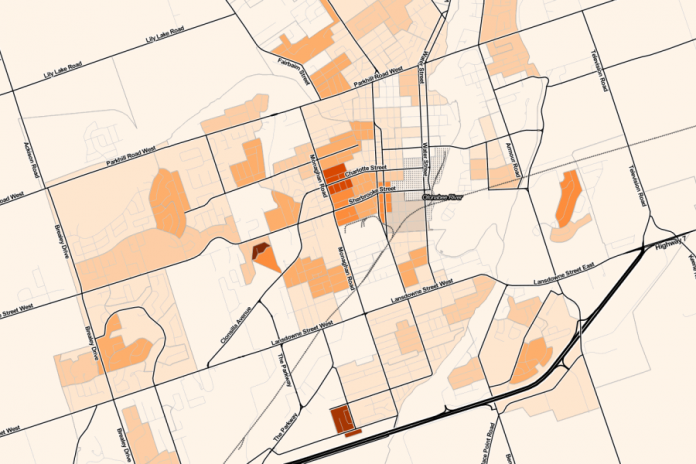
For the trick-or-treater density maps, they used Statistics Canada data that identifies areas with the highest ratios of individual dwellings of children who are “prime trick-or-treating age” (between five and 14 years old). They then used the number of private dwellings to colour-code the ratio on a map.
Darker areas on the map represent neighbourhoods with a higher density of children of trick-or-treating age. The data is from the 2011 census, but von Bergmann says that it should still be representative.
Below are links to trick-or-treater density maps for the larger urban centres in the Kawarthas that have sufficient data. You can explore these maps and others (including haunted houses!) on the Census Mapper website at www.censusmapper.ca.
- Peterborough Map – http://censusmapper.ca/maps/137?zoom=13&lat=44.2876&lng=-78.3273
- Lindsay Map – http://censusmapper.ca/maps/137?zoom=14&lat=44.3551&lng=-78.7404
- Cobourg Map – http://censusmapper.ca/maps/137?zoom=14&lat=43.9639&lng=-78.1689
- Port Hope Map – http://censusmapper.ca/maps/137?zoom=14&lat=43.9639&lng=-78.1689
MountainMath Software does not allow embedding of the Census Mapper maps in third-party websites, so please use the links above to view the maps.


